Downloading places of interest (POI) Data from OSM
Useful open street maps overpass API wrappers to download buildings and streets.
[1]:
import pandas as pd
import geopandas as gpd
import matplotlib.pyplot as plt
from nomad.map_utils import download_osm_buildings, download_osm_streets, remove_overlaps
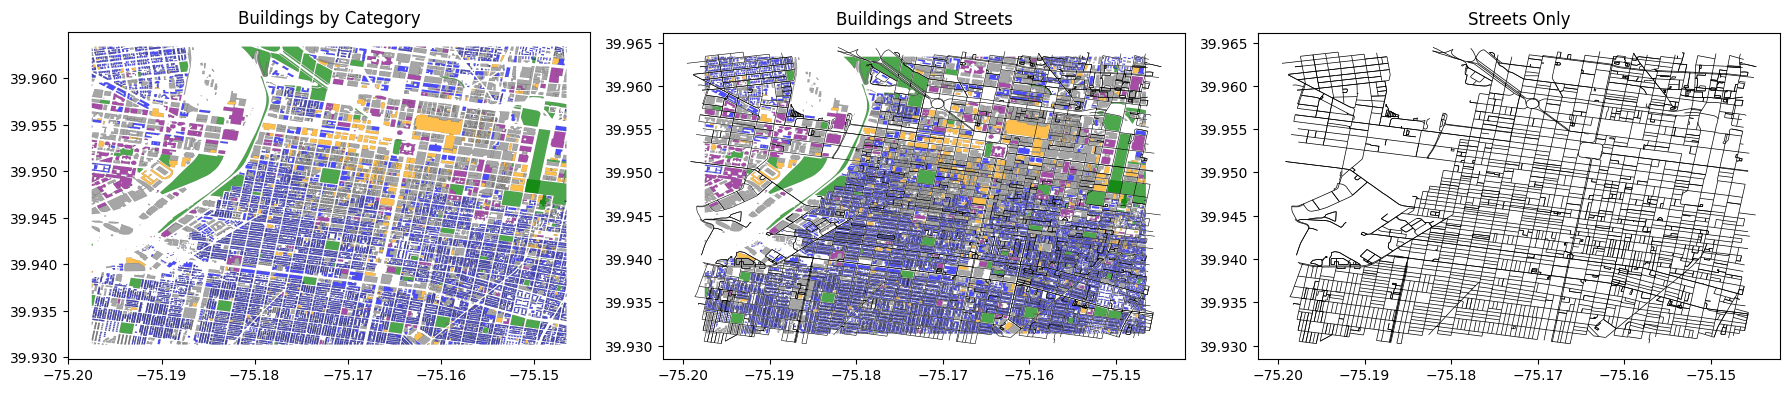
## Download by Bounding Box
bbox = (-75.19747721789525, 39.931392279878246, -75.14652246706544, 39.96336810441389)
# Download, process, and save
buildings = download_osm_buildings(bbox, schema='garden_city', clip=True, explode=True, infer_building_types=True)
streets = download_osm_streets(bbox, clip=True, explode=True)
buildings = remove_overlaps(buildings)
buildings.to_file("philadelphia_buildings.geojson", driver="GeoJSON")
streets.to_file("philadelphia_streets.geojson", driver="GeoJSON")
print(f"Downloaded {len(buildings)} buildings, {len(streets)} streets")
print(f"Building categories: {buildings['building_type'].value_counts().to_dict()}")
# Show sample of downloaded data
print("\nSample buildings data:")
print(buildings.head())
# Plot results
fig, axes = plt.subplots(1, 3, figsize=(18, 6))
colors = {
'park': 'green',
'home': 'blue',
'retail': 'orange',
'workplace': 'purple',
'other': 'grey'
}
# Buildings by category with proper colors
for category, color in colors.items():
subset = buildings[buildings['building_type'] == category]
if len(subset) > 0:
subset.plot(ax=axes[0], color=color, edgecolor='black', linewidth=0.1, alpha=0.7)
axes[0].set_title('Buildings by Category')
axes[0].set_aspect('equal')
# Buildings + Streets
for category, color in colors.items():
subset = buildings[buildings['building_type'] == category]
if len(subset) > 0:
subset.plot(ax=axes[1], color=color, edgecolor='black', linewidth=0.08, alpha=0.7)
streets.plot(ax=axes[1], color='black', linewidth=0.4)
axes[1].set_title('Buildings and Streets')
axes[1].set_aspect('equal')
# Streets only
streets.plot(ax=axes[2], color='black', linewidth=0.5)
axes[2].set_title('Streets Only')
axes[2].set_aspect('equal')
plt.tight_layout()
plt.show(block=False)
Downloaded 37954 buildings, 5584 streets
Building categories: {'home': 31427, 'other': 5639, 'retail': 545, 'workplace': 243, 'park': 100}

Sample buildings data:
  osm_type      subtype subtype_2 subtype_3 building_type osm_category  \
0      yes  residential      <NA>       NaN          home         home
1      yes  residential      <NA>       NaN          home         home
2      yes  residential      <NA>       NaN          home         home
3      yes  residential      <NA>       NaN          home         home
4      yes  residential      <NA>       NaN          home         home

             addr:street     addr:city addr:state addr:housenumber  \
0    South Taylor Street  Philadelphia         PA             1702
1    South Taylor Street  Philadelphia         PA             1700
2      South 25th Street  Philadelphia         PA             1701
3  South Ringgold Street  Philadelphia         PA             1654
4  South Ringgold Street  Philadelphia         PA             1653

  addr:postcode                                           geometry
0           NaN  POLYGON ((-75.18609 39.9314, -75.18608 39.9313...
1           NaN  POLYGON ((-75.18615 39.93147, -75.18614 39.931...
2           NaN  POLYGON ((-75.18626 39.93147, -75.18627 39.931...
3           NaN  POLYGON ((-75.1856 39.93157, -75.18561 39.9315...
4           NaN  POLYGON ((-75.18537 39.93157, -75.18532 39.931...
[2]:
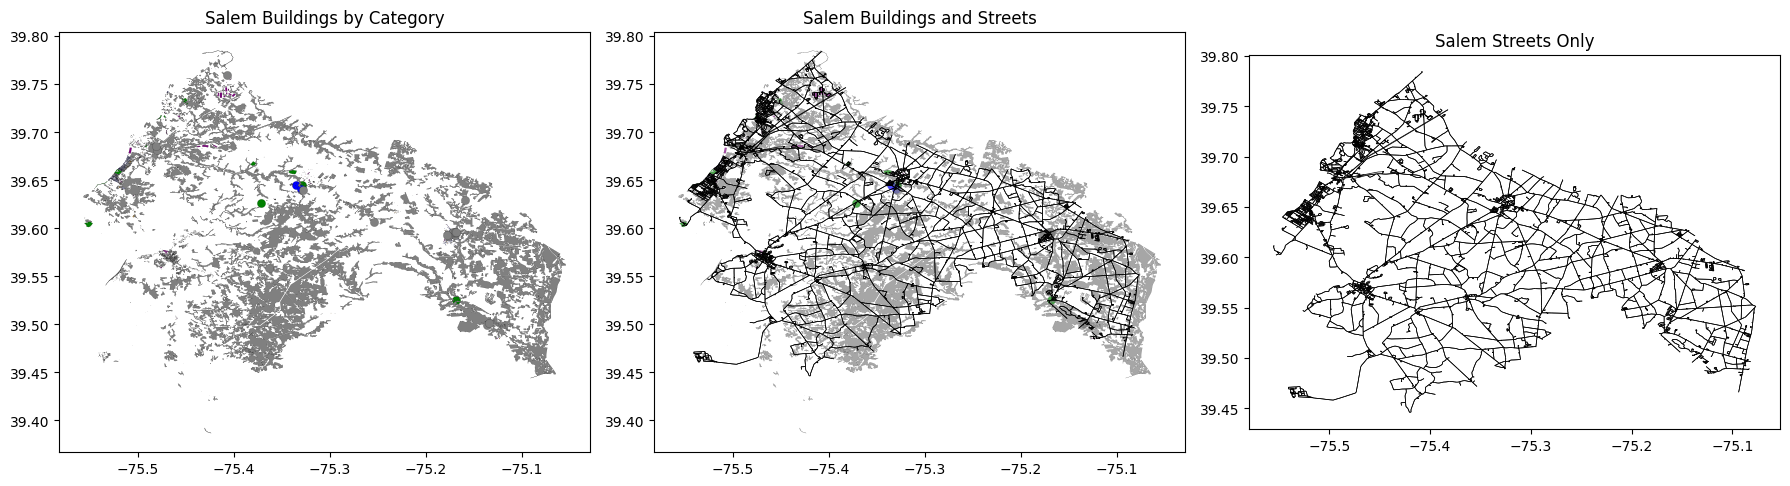
## Download geometries by City Name
city_name = 'Salem, New Jersey'

salem_buildings = download_osm_buildings(city_name, schema='garden_city', explode=True, infer_building_types=True)
salem_streets = download_osm_streets(city_name, explode=True)

# Remove overlaps
salem_buildings = remove_overlaps(salem_buildings)

# Save data
salem_buildings.to_file("salem_buildings.geojson", driver="GeoJSON")
salem_streets.to_file("salem_streets.geojson", driver="GeoJSON")

print(f"Downloaded {len(salem_buildings)} buildings, {len(salem_streets)} streets")
print(f"Building categories: {salem_buildings['building_type'].value_counts().to_dict()}")
# Show sample of downloaded data
print("\nSample Salem buildings data:")
print(salem_buildings.head())

print("\nSample Salem streets data:")
print(salem_streets.head())

# Plot Salem results
fig, axes = plt.subplots(1, 3, figsize=(18, 6))

colors = {
    'park': 'green',
    'home': 'blue',
    'retail': 'orange',
    'workplace': 'purple',
    'other': 'grey'
}

# Buildings by category
for category, color in colors.items():
    subset = salem_buildings[salem_buildings['building_type'] == category]
    if len(subset) > 0:
        subset.plot(ax=axes[0], color=color, edgecolor='black', linewidth=0.1)
axes[0].set_title('Salem Buildings by Category')
axes[0].set_aspect('equal')

# Buildings + Streets
for category, color in colors.items():
    subset = salem_buildings[salem_buildings['building_type'] == category]
    if len(subset) > 0:
        subset.plot(ax=axes[1], color=color, edgecolor='black', linewidth=0.08, alpha=0.7)
salem_streets.plot(ax=axes[1], color='black', linewidth=0.5)
axes[1].set_title('Salem Buildings and Streets')
axes[1].set_aspect('equal')

# Streets only
salem_streets.plot(ax=axes[2], color='black', linewidth=0.5)
axes[2].set_title('Salem Streets Only')
axes[2].set_aspect('equal')

plt.tight_layout()
plt.show(block=False)
Downloaded 7940 buildings, 16761 streets
Building categories: {'other': 6086, 'home': 1550, 'workplace': 155, 'retail': 135, 'park': 14}

Sample Salem buildings data:
     osm_type      subtype subtype_2 subtype_3 building_type osm_category  \
0         yes      unknown      <NA>       NaN         other        other
1         yes      unknown      <NA>       NaN         other        other
3  apartments  residential      <NA>       NaN          home         home
5  apartments  residential      <NA>       NaN          home         home
7         yes      unknown      <NA>       NaN         other        other

     addr:street   addr:city addr:state addr:housenumber addr:postcode  \
0            NaN         NaN         NJ              NaN           NaN
1            NaN         NaN         NJ              NaN           NaN
3  Bailey Street  Pilesgrove        NaN               10         08098
5   Alloway Road   Woodstown        NaN               21         08098
7            NaN         NaN        NaN              NaN           NaN

                                            geometry
0                         POINT (-75.17019 39.59249)
1                           POINT (-75.4075 39.7597)
3                         POINT (-75.33482 39.64503)
5                         POINT (-75.33003 39.64045)
7  POLYGON ((-75.31782 39.64825, -75.31779 39.648...

Sample Salem streets data:
      osmid      highway            name  oneway reversed      length  \
0  11753099  residential  Delaware Drive   False     True  180.070307
1  11758546  residential       Cove Road   False    False   83.323719
2  11757359  residential   Church Street   False    False   84.049012
3  11753099  residential  Delaware Drive   False    False  180.070307
4  11753099  residential  Delaware Drive   False     True  156.529141

   u_original  v_original  ref lanes access bridge maxspeed service tunnel  \
0   105201345   105231739  NaN   NaN    NaN    NaN      NaN     NaN    NaN
1   105201345   105215935  NaN   NaN    NaN    NaN      NaN     NaN    NaN
2   105231739   105215928  NaN   NaN    NaN    NaN      NaN     NaN    NaN
3   105231739   105201345  NaN   NaN    NaN    NaN      NaN     NaN    NaN
4   105231739   105219781  NaN   NaN    NaN    NaN      NaN     NaN    NaN

                                            geometry
0  LINESTRING (-75.47648 39.72523, -75.47604 39.7...
1  LINESTRING (-75.47648 39.72523, -75.47605 39.7...
2  LINESTRING (-75.47582 39.72676, -75.47494 39.7...
3  LINESTRING (-75.47582 39.72676, -75.47604 39.7...
4  LINESTRING (-75.47582 39.72676, -75.47577 39.7...